1 Stanford University 2 Google DeepMind 3 Google, Paradigms of Intelligence Team
We propose Competency Gaps (CG), a method that uses sparse autoencoders (SAEs) to automatically uncover two types of gaps in LLM evaluation: (i) benchmark gaps, imbalanced coverage of concepts within benchmarks, and (ii) model gaps, areas where LLMs systematically underperform. CG extracts SAE concept activations and computes saliency-weighted performance scores across benchmark data. Applied to five models across over a dozen benchmarks, our analysis reveals that models consistently underperform on concepts contrasting with sycophantic behaviors and safety-related concepts, while benchmarks over-represent concepts related to obedience and instruction-following.
Most LLM benchmarks compress performance into one number. That summary hides how performance is spread across different kinds of inputs. On a benchmark like MATH, accuracy on individual topics can swing by tens of points behind a single headline score. The same kind of dispersion exists on every benchmark; we just don't usually look.
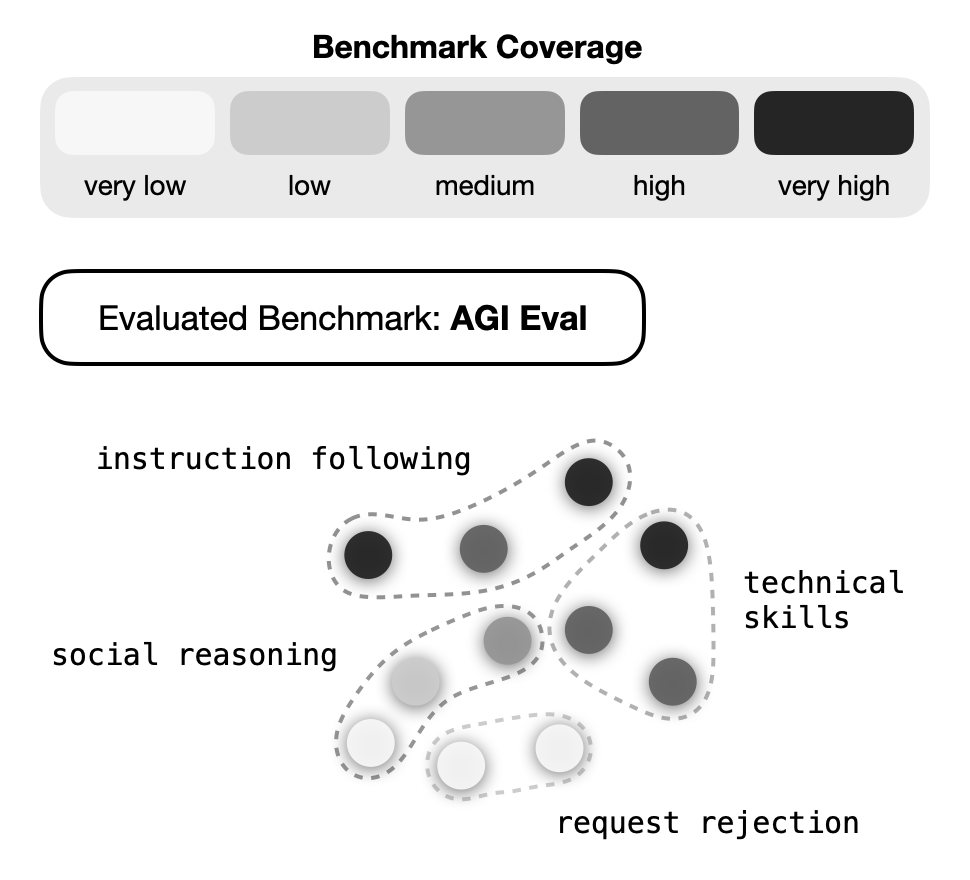
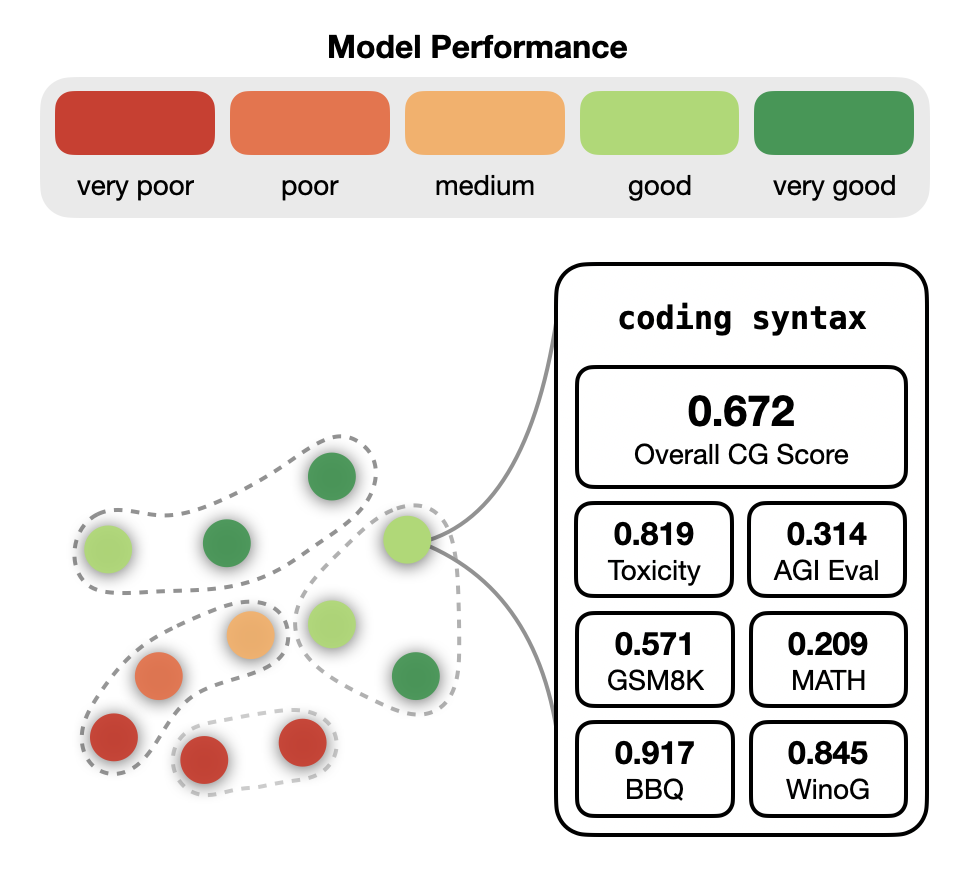
Competency Gaps (CG) gives us that disaggregated view automatically. Instead of relying on human-written topic labels, we project each benchmark example into the concept space of a sparse autoencoder trained on the model's own activations. Every concept becomes a fine-grained axis along which we can ask two questions:
Benchmark coverage ($\chi_{\text{bench}}^{(c)}$): how much does the benchmark exercise this concept?
Model performance ($\chi_{\text{model}}^{(c)}$): when the concept fires, how often does the model get the answer right?
(a) Benchmark Gaps
(b) Model Gaps
Method overview. CG decomposes an evaluation into thousands of interpretable concepts learned by a sparse autoencoder. (a) Benchmark gaps surface concepts that are underrepresented in a suite. (b) Model gaps surface concepts where the model systematically underperforms.
Example Finding 1: A few concepts dominate every benchmark
Running CG on DeepSeek-R1-Distill-Llama-8B across ten popular benchmarks (GSM8K, MATH, AGIEval, LogicBench, SocialIQA, WinoGrande, BBQ, CrowS-Pairs, Vectara, and Natural Questions), we plot the distribution of $\chi_{\text{bench}}^{(c)}$ across all ~32k concepts. The result is heavily right-skewed:
Cross-benchmark coverage is uneven. The distribution of $\chi_{\text{bench}}^{(c)}$ across all concepts shows that a few concepts dominate coverage while the vast majority are barely tested. Any mean-based aggregate score is driven by this tail.
What sits in the right tail? Concepts like:
(31763) "Intermediate values in arithmetic calculations performed step by step"
(21132) "Geometrical terms, especially discussing 3-D shapes and angles"
For this reasoning-distilled model, the tail leans heavily toward math/reasoning-coded concepts. Some of these are substantive, but many are tracking the form and structure more than the actual reasoning steps. Either way, these concepts disproportionately shape the aggregate, reported number.
At the other end, 2,730 concepts (~8.5%) are effectively untested. These include things you might reasonably want to measure:
(4492) "Mathematical reasoning and trigonometry"
(5054) "Text that contains mathematical reasoning including variables, angles, equations, and calculations"
(12843) "Code snippets relating to requests, tags, and parameters"
Example Finding 2: Each benchmark has its own blindspots
Zoom in on individual benchmarks and the same story shows up in three different shapes. First: how much of the concept space does each benchmark leave untested? The reasoning and math benchmarks cover the dictionary fairly densely (MATH and Vectara each leave under 15% untouched), but the factuality and bias benchmarks leave large holes: for example, Natural Questions misses 54% and BBQ misses 67% of all concepts.
Fraction of the SAE dictionary untested by each benchmark. Single benchmarks leave huge portions of the concept space unmeasured.
Next: you might hope that combining several benchmarks into a diverse suite would fill those holes. Often it doesn't; the benchmarks end up overlapping heavily in what they test, not just how much.
Benchmark-pair Jaccard overlap. Many benchmarks in a seemingly diverse suite end up testing overlapping concept profiles, with more redundancy than you'd expect.
And finally, inside any single benchmark, the same right-skewed dominance we saw across the full suite repeats. Each benchmark's headline score is driven by a small handful of high-activation concepts:
Per-benchmark coverage distributions are all right-skewed. Each benchmark's score is dominated by a small set of high-activation concepts.
More uncomfortably, the concepts each benchmark misses often look central to what that benchmark claims to evaluate:
Benchmark
ID
Missing concept the benchmark probably should test
LogicBench
(24511)
Words related to math problems and solutions
LogicBench
(8523)
The word “multiple” or “multiples” appearing in mathematical contexts
Social IQA
(8971)
Code comments and code fragments
Social IQA
(17303)
The words “root” or “roots”, as well as legal terms
Example Finding 3: The model has the form of math reasoning, not the substance
The same pipeline, now scoring $\chi_{\text{model}}^{(c)}$, turns into a per-concept report card for the model. R1-Distill's per-concept performance distribution is wide (median 0.433): the model is near-perfect on some concepts and close to zero on others.
R1-Distill's per-concept performance across all ten benchmarks. Wide variance, with a clear mass of near-zero concepts that the aggregate accuracy completely hides.
When we rank concepts by $\chi_{\text{model}}^{(c)}$ and read the labels, a pattern jumps out. R1-Distill, a reasoning-distilled model, is strongest on the surface forms of mathematical reasoning and weakest on its substance. (Filtered to concepts that activate in at least 5 benchmarks with ≥ 50 supporting datapoints.)
Rank
ID
Concept
Best performance
(14585)
Mentions of variables, specifically within mathematical or logical reasoning
(17004)
LaTeX math code
(17718)
The word “Alternatively”, used to introduce different reasoning steps to solve math problems
Worst performance
(32637)
Boxed numerical answers in a mathematical context
(24736)
Multi-digit numbers
(9878)
Code blocks in C# with curly braces
Read that split again. The top of the ranking is the scaffolding of chain-of-thought: declaring variables, emitting LaTeX, transitioning between reasoning steps with words like "Alternatively". The bottom is where that scaffolding has to cash out into a correct number: boxed numerical answers, multi-digit numbers, and concrete code syntax. Distillation taught the model the shape of careful reasoning far more reliably than the arithmetic it is supposed to carry out. It looks like it is reasoning; it just gets the number wrong.
Because CG is grounded in SAE activations over real examples, we can pull up the actual benchmark items and inspect the concepts that fired on them. Below are two MATH problems where the single most strongly-firing concept is (31763) "intermediate values in arithmetic calculations performed step by step"—and yet, R1-Distill still lands on the wrong number. It produces the form of a worked solution without the substance:
Real benchmark items where the most strongly-firing concepts coincide with an incorrect answer from R1-Distill. Each card shows the prompt sent to the model, the model's response, the source benchmark and outcome, and the concepts that fired most strongly on that item.
Finally, the "wide performance spread" we saw at the suite level isn't just an artifact of averaging across benchmarks; inside each individual benchmark, per-concept accuracy fans out just as widely:
Per-benchmark performance distributions. The headline accuracy for each benchmark is a weighted average over this spread.
Does it hold up?
These are examples of what CG surfaces, so the natural question is whether the scores are stable enough to trust. In the paper we run three sanity checks on the method:
Subsampling. Re-running CG many times while dropping 20% of each benchmark leaves the per-concept scores essentially unchanged — the rankings are not driven by a handful of items.
Adversarial ablation. Removing the small slice of data aligned with the top-performing concepts lowers median $\chi_{\text{model}}$, and removing the slice aligned with the worst-performing concepts raises it; put together, the score moves in the direction CG predicts.
Different SAE, same story. Swapping in an SAE trained on a different model yields coverage/performance distributions of the same shape, with the top and bottom concepts lining up interpretively.
(The quantitative robustness numbers and cross-SAE comparison reported in the paper were measured on the original Llama deployment; the same checks are being re-run for DeepSeek-R1-Distill-Llama-8B.)
Explore it yourself
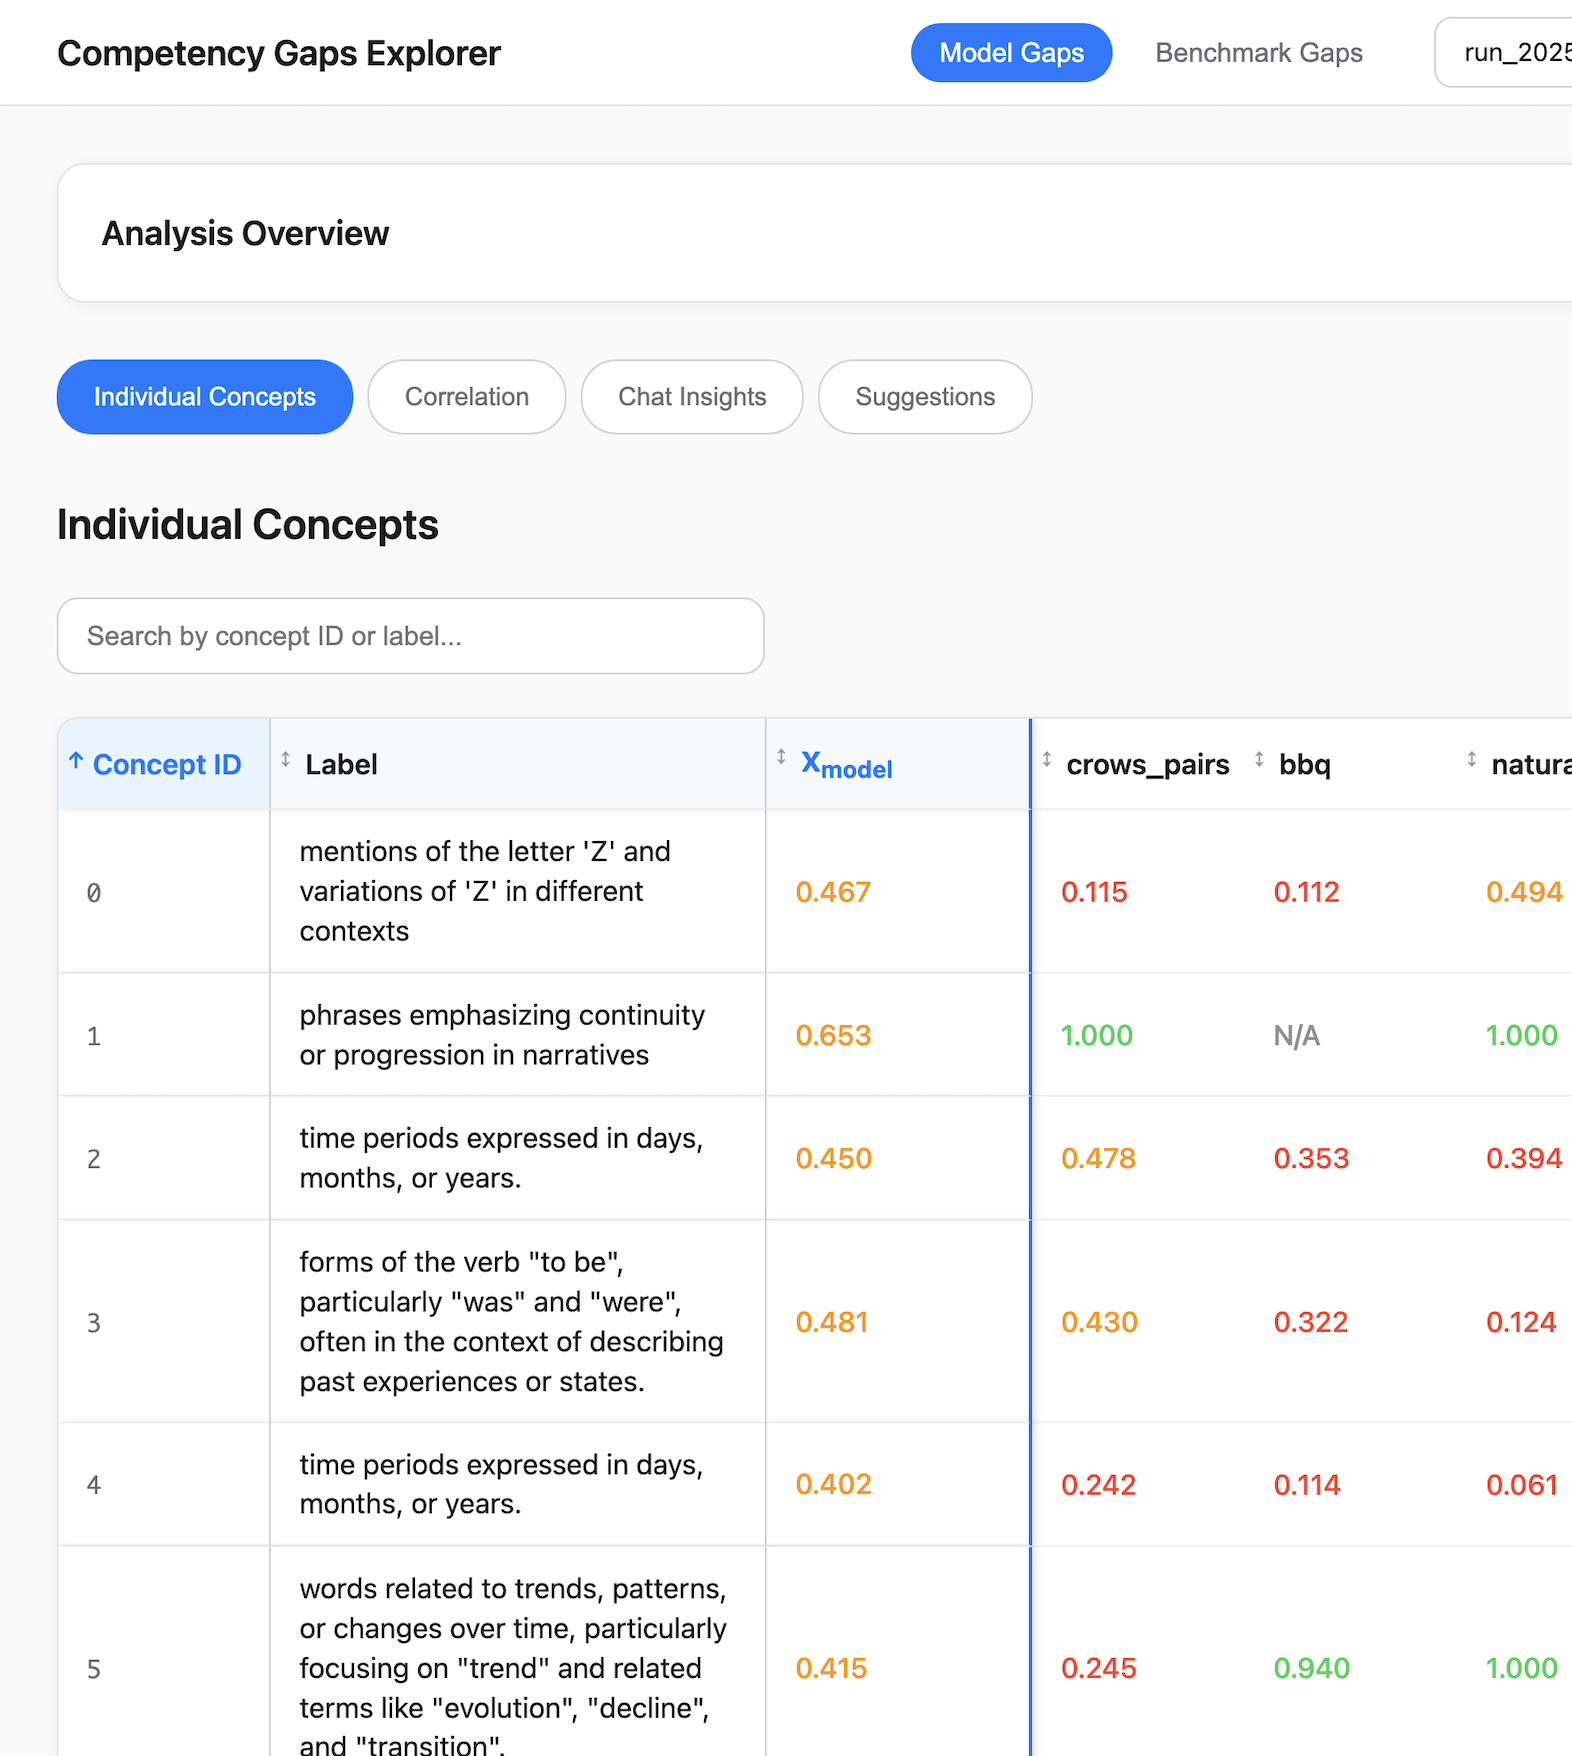
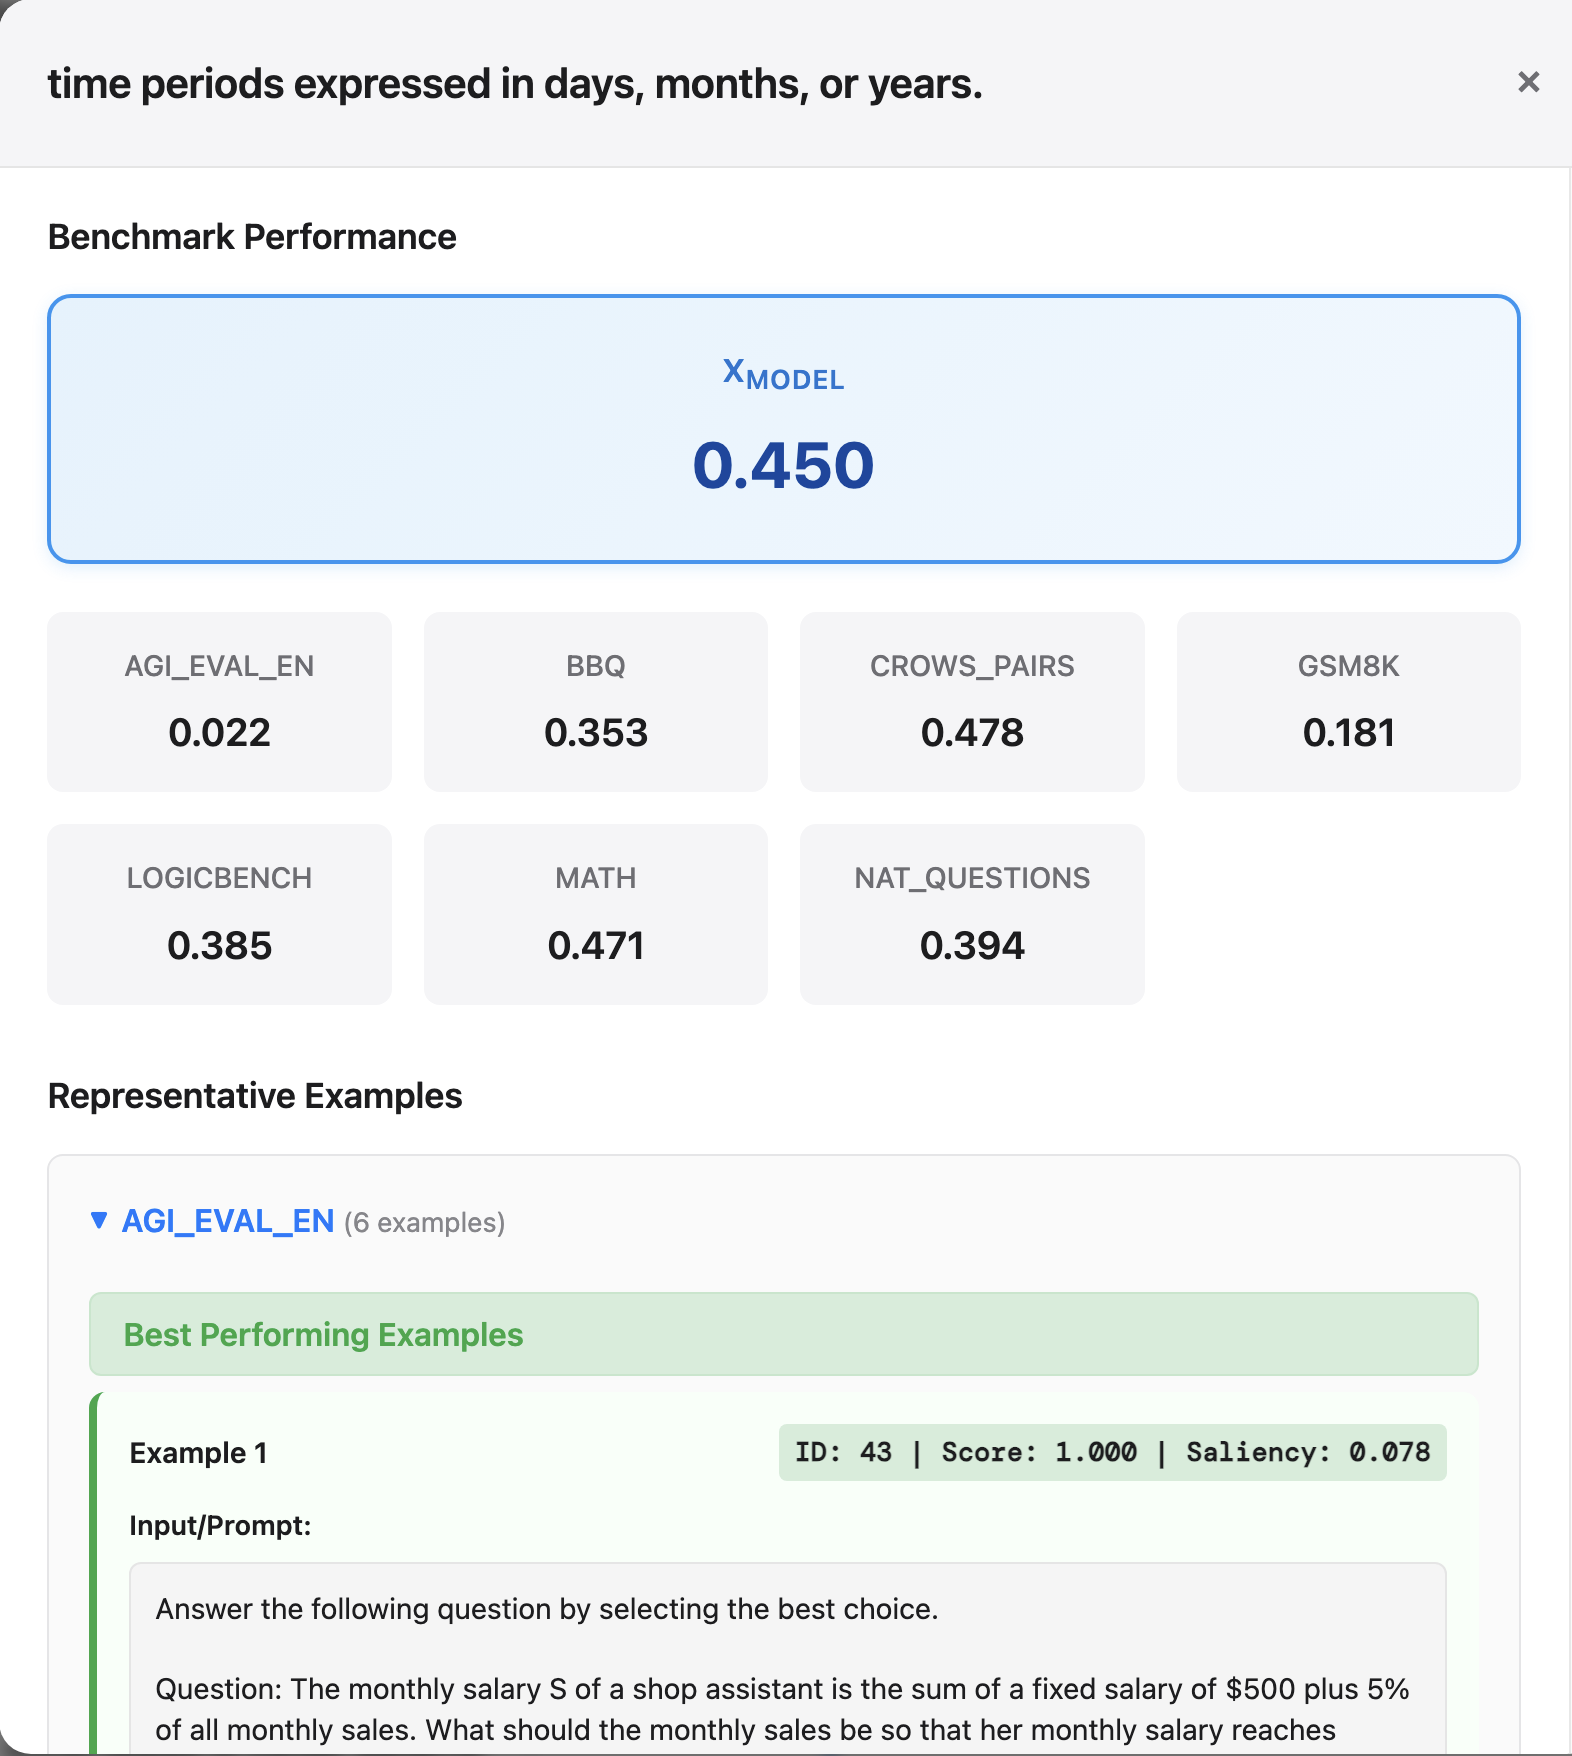
CG produces thousands of per-concept scores per model. We built an interactive viewer to make that volume usable: search and filter concepts, inspect per-benchmark breakdowns, and jump directly to the example data points that drove any particular score.
(a) Main View
(b) Concept Detail
Interactive exploration app. Concept list, per-concept detail modal with per-benchmark scores, coverage and correlation views, and drill-down into the examples that drove each score.
Code and data loaders for running CG on your own model or benchmark are open-sourced. Two useful workflows to start with:
Audit a benchmark suite. Run CG over your candidate benchmarks, sort concepts by $\chi_{\text{bench}}^{(c)}$, cluster the low end with an LLM, and add data targeting whatever's missing that matters for your use case.
Audit a model. Same pipeline, but sort by $\chi_{\text{model}}^{(c)}$. The bottom of the list is your weakness list, grounded in the model's own representations.
Citation
@article{bohacek2025uncovering,
  title={Uncovering Competency Gaps in Large Language Models and Their Benchmarks},
  author={Bohacek, Matyas and Scherrer, Nino and Dufour, Nicholas and Leung, Thomas and Bregler, Christoph and Chan, Stephanie CY},
  journal={arXiv preprint arXiv:2512.20638},
  year={2025}
}
Acknowledgements
The authors would hereby like to thank the following colleagues, listed in alphabetical order, for helpful discussions: Tom Lieberum, Neel Nanda, Senthooran Rajamanoharan, and Jasper Snoek.